In today’s article, our friend at Monument Traders Alliance Bryan Bottarelli shows you a pattern that might change the way you look at both bull and bear markets forever.
He calls it the Perfect Timing Pattern… and it can help you quickly determine whether a stock is headed up or down.
During the COVID-19 crash, this pattern helped his followers lock in 246% total gains while the market FELL over 20%.
It’s so essential for times like these that he’s making a special lesson available to our readers for FREE (check it out right here).
– Madeline St.Clair, Assistant Managing Editor
In the current bear market, it’s easy to panic. It’s easy to listen to media “doom and gloom.”
We urge you not to do that.
The truth is…
These are times when you should not only be protecting your assets but even be a little GREEDY.
Here we’re going to show you one of the simplest, most effective ways to profit in any market.
This simple pattern is going to show you whether a stock will go up or down.
The crazy thing is… not many people use this pattern.
That’s right… nobody trades this way.
But I do – because it’s so simple.
The pattern I’m talking about is what I call a “W” pattern.
In my experience, the “W” pattern is the best way to determine whether a stock will go up or down.
Here’s how it works.
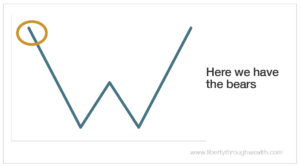
Starting from the upper left of the “W,” you have the bears.
They push the stock lower and lower, as you can see below.

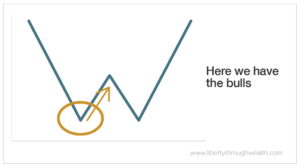
Then you have the bulls, who create a level of support.

The bulls bounce the stock up to the neckline of the “W”…
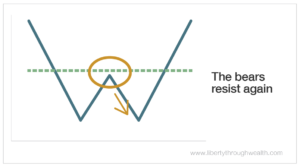
Then the bears resist again and push it down to the support level a second time.

Then the magic happens…
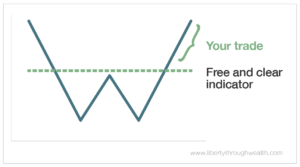
If the bulls bounce it at that support level and move it above the neckline of the “W,” that right there is a sign the bulls are in control and THAT’S when you make your trade.

That is the most powerful bullish formation you’ll ever see.
Now, see what happens when the “W” formation moves above the “free and clear” indicator.
Yes, a big upside move.
The truth is…
When you know this indicator, you can make money ALL. DAY. LONG.
This pattern alone provides TENS OF MILLIONS of profit opportunities. It happens hundreds of times every single trading day.
And the gains can come in just 15 minutes.
The great part is it’s super simple to use.
There are a lot of different chart patterns out there, but many of them are too complicated to learn.
You don’t need to be a math genius or a business wizard to figure out the “W” pattern.
You don’t need all these in-depth indicators.
You don’t need 100 flashing TV screens to follow every second of the market.
You just need this one pattern.
And once you know how to identify the “free and clear” signal, you can make profits consistently.
The Best Way to Track the “W”
Right now, you might be thinking…
“OK, I understand how the ‘W’ pattern works, but how do I know if I’m tracking it properly?”
One of the best ways to track the “W” pattern is by using a 3-minute chart.
These 3-minute charts allow you to track stock movement minute by minute.
By doing this, you’ll avoid using old data from weekly and yearly charts, which is like trying to cash a winning lottery ticket with yesterday’s Powerball numbers.
Instead, you’ll see a live, real-time look at the stock price movements within that time. Any number of transactions could appear during this period.
Knowing how to use a 3-minute chart will provide the foundation for identifying the “W” pattern in as close to real time as possible.
So to sum it all up…
One of the most effective ways to make profits in your trades is through the “W” pattern.
And one of the most effective ways to track this pattern is through a 3-minute chart.
That’s it.
Happy trading,
Bryan
