October was a month for the history books.
The S&P 500 fell 16 out of 22 trading days. That’s happened only three times since 1928. Last month also marked the index’s worst October performance since 1970.
The recent market panic served as a reminder that the painful memories of the 2008 financial crisis are still seared in the minds of investors. And the relentless drumbeat of negativity from permabears trotted out by the financial media only stoked the fires of worry.
I’ve written before how the worst thing you can do is listen to the Chicken Littles of the media – and take their advice to sell in a falling market.
If you have ever tried to time the market, you know that we humans are uniquely ill-equipped to make accurate decisions in the face of market panics. And if you did sell into the recent downturn, you may already be regretting it.
All this leads to a fundamental insight about investing they don’t teach you in any finance textbook…
The biggest challenge you will face during a market correction isn’t a slowing economy, disappointing earnings or the impact of the latest presidential tweet…
The biggest challenge is managing your own psychology.
The evidence is clear. A hasty decision to sell your stocks during a market correction will cost you more than you can imagine.
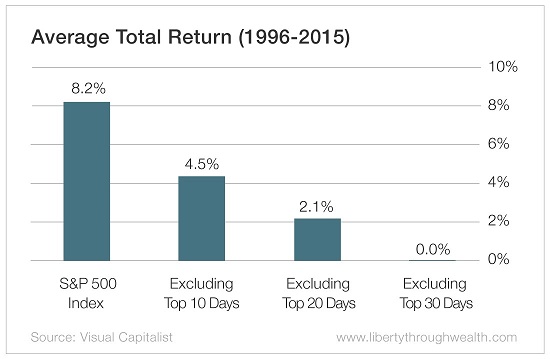
I’ll reveal just how much in the chart below.
But first, let’s put the October pullback into historical perspective.
On average, corrections – defined as at least a 10% pullback in the market – happen once a year.
That means you can expect to see as many corrections in your life as you do birthdays.
The S&P 500 has fallen an average of 14.2% at least once each year between 1980 and 2015. (That makes October’s pullback of roughly 10% seem benign.)
And corrections aren’t the end of the world. That’s because less than 20% of them turn into bear markets.
Put another way… 80% of corrections are just short pauses in an otherwise normal bull market.
Furthermore, even in the face of corrections and bear markets, the S&P 500 has generated a positive return in 27 of the last 36 years. If you check your account only once a year on December 31, it will be up about 75% of the time.
You often hear how the investment game is rigged. The good news is that it’s rigged in your favor.
Of course, all rational arguments go out the window during a market panic.
When the stock market starts tumbling, you may be tempted to abandon ship by selling assets and moving into cash.
However, doing so would be a big mistake.
Odds are excellent that you’d be selling your assets at a lousy price just before the market rebounded.
The evidence on this is clear…
You need to miss only a few days of being in the stock market to decimate your longtime returns.

Between 1996 and 2015, the S&P 500 returned an average of 8.2% a year.
If you missed out on only the top 10 trading days during these 20 years, your returns would have dropped to 4.5% a year.
If you missed out on the top 20 trading days, your returns would have halved yet again to just 2.1%.
And if you missed out on the top 30 trading days, you’d have made no money for 20 years!
The lesson?
The next time you find yourself squirming during a market correction, just hold on tight.
Odds are excellent that the financial storm will pass within a few weeks.
All this leads to a counterintuitive conclusion…
The biggest threat to your financial future isn’t being fully invested during a correction.
The biggest threat is not being invested at all.
Good investing,
Nicholas
