The year was 1998.
I was managing several emerging markets mutual funds in London. My focus was on the newly emerging markets of Eastern Europe and Russia.
The world was at the tail end of a go-go era in emerging markets.
I watched friends make millions of dollars by betting big on the Russian stock market.
The world was clamoring to buy Russian assets – whether stocks or bonds. Russian natural gas giant Gazprom (OTC: OGZPY) was racing Cisco (Nasdaq: CSCO) to become the first trillion-dollar company on the planet.
Click here to watch Nicholas’ latest video update.
Then everything changed on August 13, the day Russia defaulted on its debt.
Major hedge fund Long-Term Capital Management made a massive leveraged bet on Russia.
The fund had two Nobel Prize winners among its partners. But that didn’t prevent its bet from bringing the entire global financial system to the brink of collapse.
Investors fled Moscow in droves, vowing never to come back.
I recall a quote from the front page of the Financial Times from one anonymous fund manager: “I would rather eat nuclear waste than invest in Russia.”
What does this story have to do with U.S. stock markets in 2020?
A lot more than you think.
Let me explain.
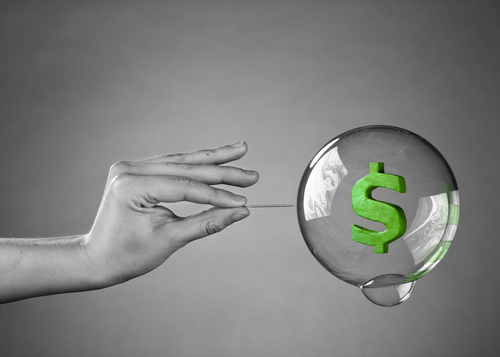
Financial Bubbles Explained
Today, when I look at financial market bubbles, I recall Yogi Berra’s observation: “It’s déjà vu all over again.”
Financial bubbles occur with remarkable regularity.
Whether it’s tulip bulbs in Holland in 1637…
Shares in the South Sea Company in 1720…
Or the dot-com boom of the late 1990s…
Financial bubbles are remarkably similar.
First, all are driven by a compelling story.
Today, that story is “disruptive technology.”
In 2020, any stock with exposure to the cloud, digital payments, electric vehicles or the stay-at-home economy has soared. Valuations have become untethered from traditional measures.
Second, the story always ends the same way.
Only the names and places change. The bubble inevitably bursts. Paper fortunes go up in smoke. Today’s heroes become tomorrow’s zeros.
The Crash of 1929
The stock market crash of 1929 offers important lessons for today’s market. History may not repeat itself. But it does rhyme.
In the late 1920s, America was in the midst of a technology boom, much like today.
Automobiles, talking films, refrigerators and the radio transformed the lives of Americans forever.
The soaring stock market affirmed America’s economic greatness. The Dow Jones average confirmed this to the mathematical precision of two decimal points.
Unlike the dirty task of building a factory, stock speculation was simple. Homemakers watched stock tickers compulsively at New York City brokerage offices. Even General Motors founder Billy Durant declared that making a fortune in the market was far easier than building a Chevrolet.
The rising stock market earned “stock operators” reputations as clairvoyant folk heroes. A 37-year-old Michael Meehan, a former ticket tout for Broadway shows, became the “master of the market” in RCA (Radio Corporation of America) shares.
By September 3, 1929, the Dow Jones Industrial Average, which included U.S. Steel, Standard Oil, General Electric, Sears Roebuck, RCA and Westinghouse, had climbed to a record level of 381.17.
But momentum started to fade into the fall.
On Monday, October 21, the stock market began its collapse. Over eight days, culminating on October 29, 1929, the Dow Jones Industrial Average shed one-third of its value.
Are We in a Bubble Today?
Financial bubbles blow when wildly exaggerated stock stories become untethered from share prices.
And by some measures, the current U.S. stock market may be the greatest financial bubble in history.
First, stocks are trading at unprecedentedly high price-to-sales ratios.
Today, 530 of America’s 8,513 listed common stocks trade at more than 10 times sales. This is 6.2% of all common stocks.
Only at the very top of the dot-com bubble, in March of 2000, did this number go higher (6.6%).
In 2000, three of the top 10 U.S. stocks by market capitalization had price-to-sales ratios higher than 10: Cisco, Intel and Oracle.
Today, four of the top 10 U.S. stocks have price-to-sales ratios of more than 10: Microsoft, Facebook, Tesla and Visa.
Second, Warren Buffett’s favorite indicator – the stock market cap-to-GDP ratio – is flashing red.
The total value of U.S. stock holdings rose from 60% of GDP in 1990 to 120% of GDP in 1996.
Today, the stock market cap-to-GDP ratio in the U.S. is just shy of 200%.
The S&P 500 alone is worth about $30 trillion, or 150% of GDP.
When this will end is impossible to say.
But end it will.
The Tesla Bubble
All stock booms have their heroic go-go stock.
Today, that stock is Tesla.
About a week ago, Tesla commanded a market capitalization of about $400 billion.
That was up from $80 billion in March and $40 billion one year ago.
Then it went on to lose $100 billion in just three trading days.
I can’t tell you what will happen next to Tesla.
But I can tell you what happens with stocks just like it.
In the 1920s, RCA was the Tesla of its day.
Magazine articles profiled RCA investors with headlines like “‘RADIO’ HAS MADE A NEW MILLIONAIRE.” (“Radio” meant “RCA.”)
RCA’s stock price peaked at $114 in September 1929. On October 21, it dropped 11 points to $68. The next day to $58. Then a few days later to $40.
Whether it was RCA in 1929, Russian stocks in 1998 or Tesla in 2020, bubble stocks always burst.
It’s not a question of if but when.
And that’s a lesson you can take to the bank.
Good investing,
Nicholas

