Pity the black swan.
For centuries, this noble bird lived in peaceful obscurity among the pages of philosophy books penned by David Hume, John Stuart Mill and Karl Popper.
But thanks to the popularity of Nassim Nicholas Taleb’s 2007 best-seller, The Black Swan: The Impact of the Highly Improbable, today you’ll find it mentioned almost daily in the world’s financial pages.
In the Middle Ages, Europeans believed that all swans were white.
After all, for hundreds of years, they had never seen anything to the contrary…
That is, until a Dutch explorer in 1697 discovered that Western Australia is home to black swans.
So what does the black swan have to do with investing?
As Taleb defines it, a “black swan” event is rare, high impact and unexpected – the kind of occurrence that changes everything.
It’s the Black Monday crash that wiped out 22.6% of the S&P 500 on October 19, 1987.
It’s the fall of the Berlin Wall in 1989 that foreshadowed the collapse of the Soviet Union.
It’s the planes crashing into the World Trade Center, Pentagon and field outside Shanksville, Pennsylvania, on September 11, 2001, that unleashed the “war on terror.”
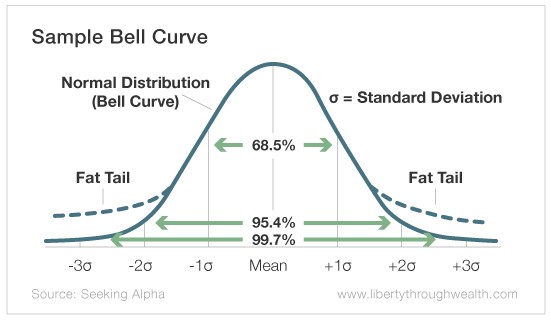
In financial markets, black swans are also called “tail risk.”
Specifically, when financial markets fall unexpectedly fast and hard – and because these sharp falls occur more often than they should – the tails on the normal bell (distribution) curve you find in finance textbooks are “fat.”

Consider the example of the U.S. stock market…
A three-standard-deviation event – a daily move on the S&P 500 of plus or minus 2.92% from the average – has happened 229 times from 1950 to 2016.
That tally is almost five times higher than it would be given a normal distribution.
And you’d expect a five-standard-deviation event (a probability of less than 1 out of 1.35 million) to occur only once every 6,900 years.
Yet the U.S. stock market has suffered 50 five-standard-deviation events since 1950.
The lesson?
Financial markets are more volatile and dangerous than finance professors predict.
Why Bother With Tail Risk?
It may seem odd to worry about a sharp market move downward. After all, the S&P 500 is hitting new record highs…
The Trump tax cuts continue to propel the U.S. stock market forward…
And there’s been no better place to invest than the U.S. stock market since global markets bottomed in March 2009.
Still, the sharp pullback in January reminded investors that stock markets don’t go straight up without pausing to take a breath.
And a black swan can come out of the blue at any time.
So how can you best protect your portfolio?
I’ve written before how you can buy put options that rise in value when the market tumbles by constructing a “barbell portfolio.”
But I see two challenges with this approach…
First, managing a dynamic portfolio of put options is challenging… even for someone who does it for a living.
Second, watching options expire worthless month after month exacts a high psychological toll.
Here’s some good news…
Today, the Cambria Tail Risk ETF (CBOE: TAIL) implements the put-buying strategy for you.
Specifically, this ETF invests about 5% of its assets in a portfolio of out-of-the-money put options on the S&P 500. It holds the rest of the assets in 10-year U.S. Treasurys.
Both Treasurys and put options tend to rise during a market crash. But like any other form of insurance, this protection costs money.
Cambria spends roughly 1% of the fund’s total assets purchasing put options over rolling one-month periods.
Put another way, this “insurance” costs you about 1% per month.
And throw in the price of missing out on the S&P 500’s rise, and the cost of holding the Tail Risk ETF doubles.

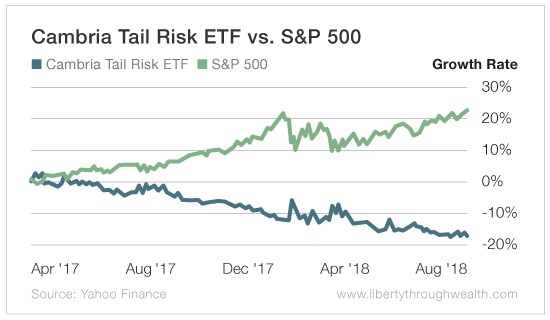
Cambria Tail Risk ETF vs. the S&P 500
Since the Tail Risk ETF launched in April 2017, the S&P 500 has risen about 22%.
Meanwhile, the price of the Tail Risk ETF has fallen by more than 17%.
Had you invested $100,000 in an S&P 500 index fund at launch, your portfolio would now be worth about $122,000.
Had you invested $90,000 in an S&P 500 index fund and $10,000 in the Tail Risk ETF at the same time, your initial investment would be worth $118,100.
All in, your “insurance” would have cost you about $230 per month.
The bottom line?
A specialist ETF like the Tail Risk ETF isn’t for everyone. Frankly, it’s tough to watch your money go down the drain, month after month – especially if the market continues to rise.
The insurance the Tail Risk ETF offers will always seem expensive…
Until the day the market crashes.
On that single day, you will look like an investment genius.
But it’s a game few investors are willing to play. Are you?
Good investing,
Nicholas
